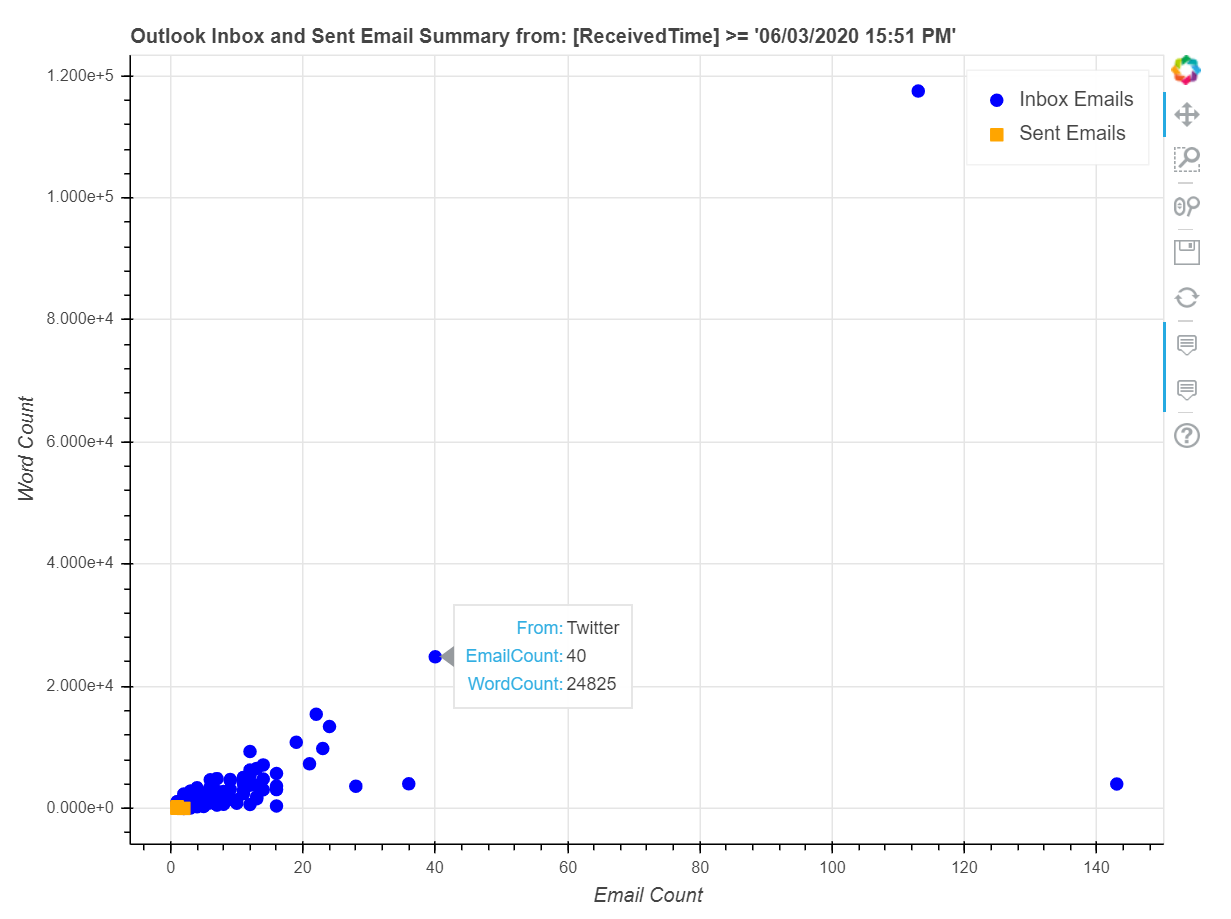
Notebook creates a summary of the # of emails sent and received from Microsoft Outlook within a specific period defined - it uses the Bokeh to create the interactive visualization.

# Import all the modules required

import pandas as pd
from win32com.client import Dispatch
import datetime as dt
from bokeh.plotting import figure, output_file, show
from bokeh.models import ColumnDataSource
from bokeh.models.tools import HoverTool
# Calculate specific date/time
last24Hours = dt.datetime.now() - dt.timedelta(hours = 24)
lastWeek = dt.datetime.now() - dt.timedelta(days = 7)
lastMonth = dt.datetime.now() - dt.timedelta(days = 30)
lastTwoMonths = dt.datetime.now() - dt.timedelta(days = 60)

# Convert the text into a format that Outlook understands.
last24HourMessages = "[ReceivedTime] >= '" +last24Hours.strftime('%m/%d/%Y %H:%M %p')+"'"
lastWeek = "[ReceivedTime] >= '" +lastWeek.strftime('%m/%d/%Y %H:%M %p')+"'"
lastMonth = "[ReceivedTime] >= '" +lastMonth.strftime('%m/%d/%Y %H:%M %p')+"'"
lastTwoMonths = "[ReceivedTime] >= '" +lastTwoMonths.strftime('%m/%d/%Y %H:%M %p')+"'"
fromThisMorning = "[ReceivedTime] >= '" +dt.datetime.now().strftime('%m/%d/%Y ')+"7:00 AM'"

# Test print out of the output
print(lastMonth)
[ReceivedTime] >= '06/03/2020 15:51 PM'
# Use this to change the filter based on the time restriction filters above.
# This will be used in the code below as the main filter for dates when the code runs
emailfilter = lastMonth

## Connect to Inbox
outlook = Dispatch("Outlook.Application").GetNamespace("MAPI")

# "6" refers to the index of a folder. 6 is the inbox
inbox = outlook.GetDefaultFolder('6')
sent = outlook.GetDefaultFolder('5')

# all inbox in the lastHourDateTime (above)
inbox_emails = inbox.Items.restrict(emailfilter)
sent_emails = sent.Items.restrict(emailfilter)

inbox_from = []
inbox_mail_wc = []

sent_to = []
sent_mail_wc = []

## iterate through list of emails in inbox, and filter based on message class 43 = email.

for msg in inbox_emails:
    if msg.Class == 43:
        # cast the object as a string
        inbox_from.append(str(msg.Sender))
        inbox_mail_wc.append(len(str(msg.Body).split()))

inbox_df = pd.DataFrame(list(zip(inbox_from, inbox_mail_wc)))
inbox_df.columns = ['Inbox_from','Inbox_wc']

## Sent email section

for msg in sent_emails:
    if msg.Class == 43:
        # cast the object as a string
        sent_to.append(str(msg.To))
        sent_mail_wc.append(len(str(msg.Body).split()))

sent_df = pd.DataFrame(list(zip(sent_to, sent_mail_wc)))
sent_df.columns = ['Sent_to','Sent_wc']


# This code uses aggregates and produces new column names with count and sum, then sorting the values based on nlargest
inbox_summary = inbox_df.groupby(['Inbox_from'])['Inbox_wc'].agg(InboxEmailCount=('Inbox_from','count'), InboxWordCount=('Inbox_wc','sum')).sort_values(['InboxEmailCount','InboxWordCount'],ascending=False).nlargest(200,'InboxEmailCount')

sent_summary = sent_df.groupby(['Sent_to'])['Sent_wc'].agg(SentEmailCount=('Sent_to','count'), SentWordCount=('Sent_wc','sum')).sort_values(['SentEmailCount','SentWordCount'],ascending=False).nlargest(200,'SentEmailCount')
inboxsource = ColumnDataSource(inbox_summary)
sentsource = ColumnDataSource(sent_summary)

# Create an interactive HTML report
output_file('OutputReport.html')

p = figure(plot_width=800, plot_height=600)

r1 = p.circle(x='InboxEmailCount', y='InboxWordCount',
         source=inboxsource,
         size=8, color='blue', legend_label='Inbox Emails')

r2 = p.square(x='SentEmailCount', y='SentWordCount',
         source=sentsource,
         size=8, color='orange', legend_label='Sent Emails')


p.title.text = 'Outlook Inbox and Sent Email Summary from: ' + emailfilter
p.xaxis.axis_label = 'Email Count'
p.yaxis.axis_label = 'Word Count'

p.add_tools(HoverTool(renderers=[r1], tooltips=[
    ('From', '@Inbox_from'),
    ('EmailCount', '@InboxEmailCount'),
    ('WordCount', '@InboxWordCount')
    ]))

p.add_tools(HoverTool(renderers=[r2], tooltips=[
    ('To', '@Sent_to'),
    ('EmailCount', '@SentEmailCount'),
    ('WordCount', '@SentWordCount')
    ]))

show(p)